Knowing the Crops, By Growing the Crops:  Renee Haugerud, the hedge fund expert behind the SilverPepper Commodity Strategies Global Macro Fund.

Play


SilverPepper Commodity Strategies Global Macro Fund.

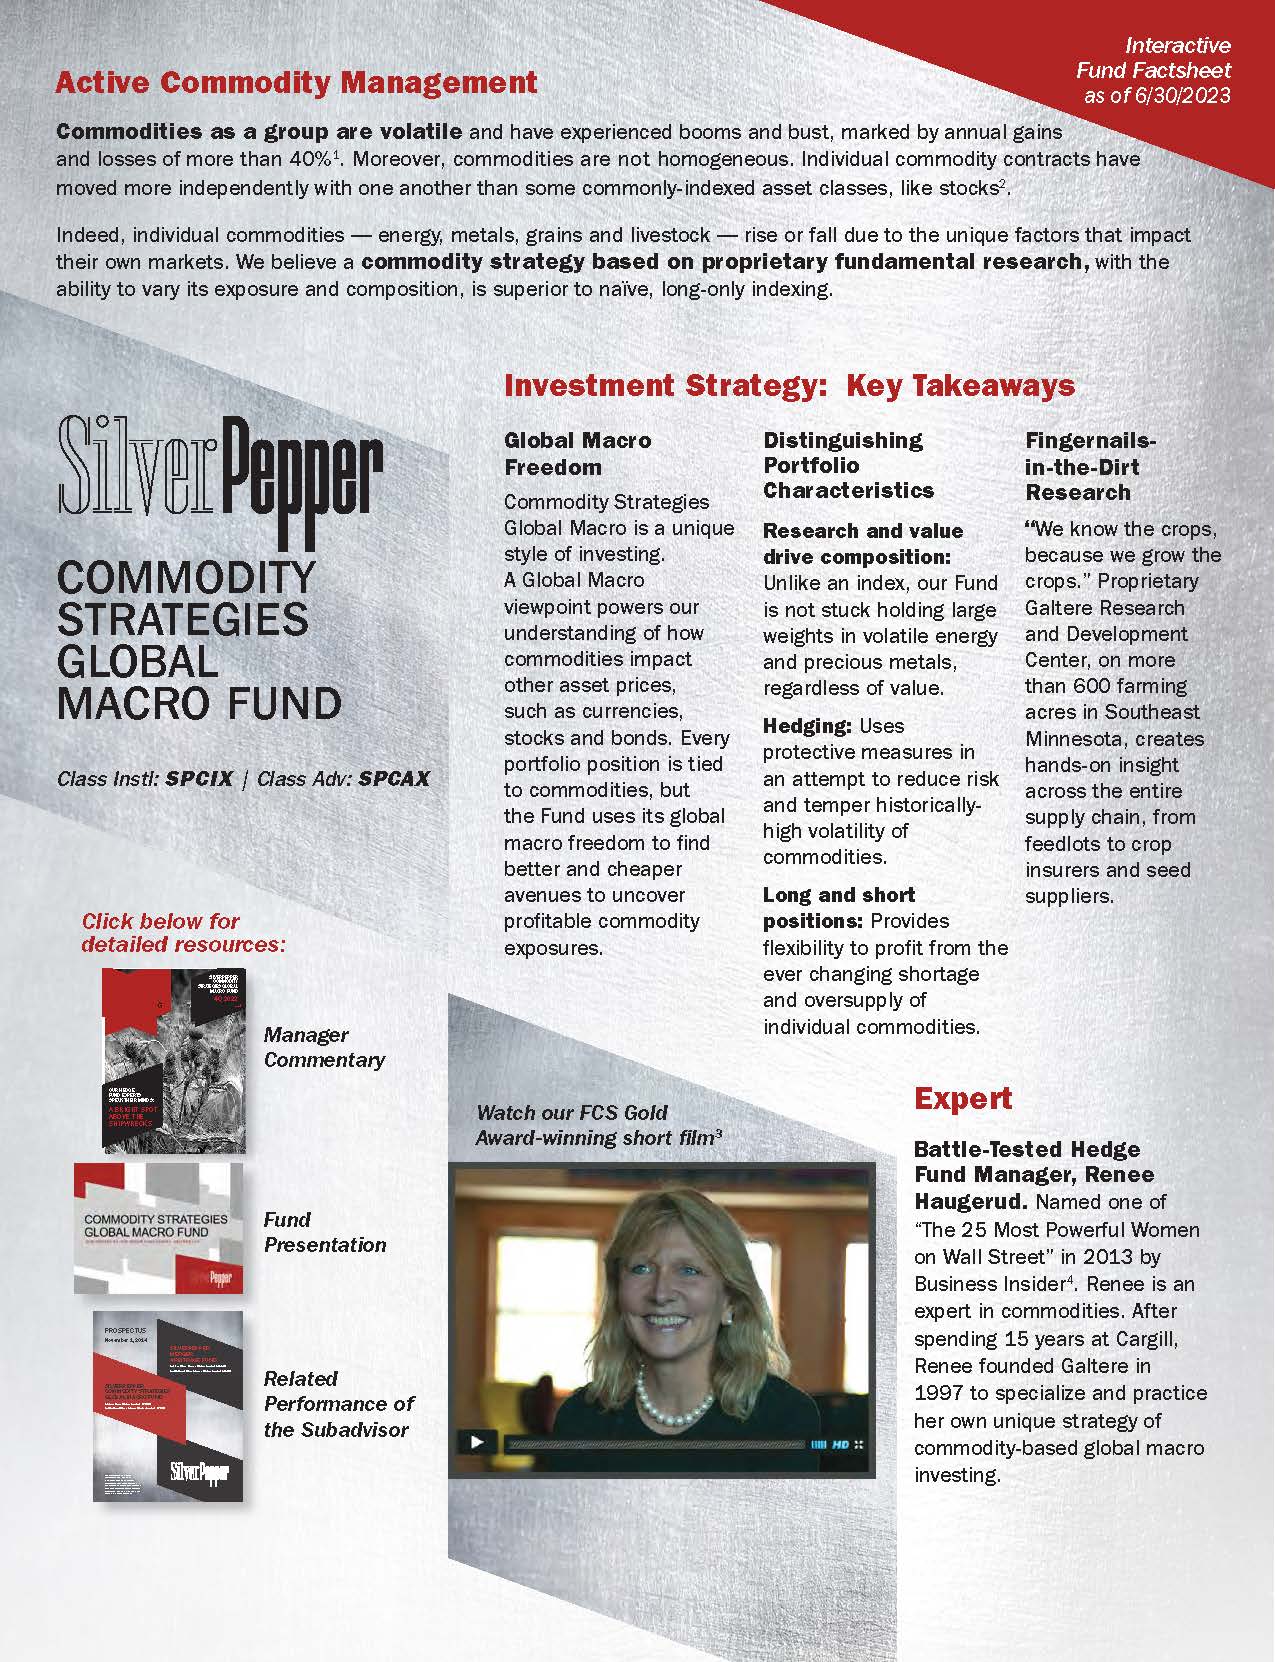
Fingernails-in-the-dirt research

Distinguishing characteristics of the SilverPepper Commodity Strategies Global Macro Fund:

  • Renee Haugerud is an expert in commodities.  With commodities pulsing through her veins, Renee struck out from Cargill 20 years ago to start her own firm, Galtere Inc., and practice her own unique version of commodity investing:  Commodity Strategies Global Macro.
  • Named one of “The 25 Most Powerful Women on Wall Street” in 2013 by Business Insider.
  • Battle-tested track record of skillfully managing a substantially similar, privately-offered commodity-strategies global-macro hedge fund.  Click here to view the related performance, risk and correlation data of the private fund in our Prospectus.
  • Galtere Research and Development Center:  Proprietary agricultural and alternative energy center encompassing more than 600 acres in Southeast Minnesota, which provides valuable insights into commodity prices across the entire supply chain, from feedlots to suppliers of fertilizers.  If you grow the crops, you know the crops.
  • Global-macro viewpoint powers an understanding of how and why commodities may impact an array of assets, ranging from commodities to currencies, stock and bonds.
  • All investment positions influenced by commodity prices, but the freedom of having a global macro viewpoint provides the ability, through investing in other asset classes, to find better and cheaper avenues to gain commodity exposures.
  • Uses both long and short positions to temper commodity risk and create broader opportunities for profit.
  • Ability to diversify beyond typical gold and oil commodity markets.  Strong skill set and expertise in investing in lesser trafficked commodities, particularly agricultural commodities.


Knowing the crops, by growing the crops.

Short Film:  Seeing global-macro events through the colored lens of commodities.  Understanding Commodity Strategies Global Macro.

Play

An active approach to commodities investing.

Viewing the world’s markets through a commodity lens

Key takeaways about commodities-strategies global-macro as an investment strategy:

  • Commodities drive the world, but their interrelationships with other assets often go unnoticed, except to the observant eye that views the world through the colored lens of commodities.
  • Commodity Strategies Global Macro is a unique style of investing.
  • Global-macro viewpoint powers an understanding of how commodity prices impact world events, and other asset prices.
  • Invests primarily in commodities, but uses its global macro freedom to find better and cheaper avenues to gain commodities exposure.
  • Uses both long and short positions to create hedges that temper volatility, as well as to create additional avenues to profit from ever changing commodity prices.
  • Invests in an array of diversifying and lesser trafficked commodities, particularly agricultural commodities.
  • Fundamentally different from either commodity or global macro strategies, which provides a framework for important diversification benefits for an investors’ portfolio.
  • Commodity Strategies Global Macro’s risk is dependent on active management and active decision making across global markets.  Long positions could fall in value, and short positions may rise or be imperfect hedges.  Investors in the Fund could lose money. SilverPepper investors need to be aware of the risk and be prepared for it.  Be a smart investor!  View the Fund’s Principal Risks here.

Comprehensive Fund Presentation: Learn More. Be Smart.


CLICK HERE.

Repository of insights.

Our hedge fund experts speak their minds

Candid observations of markets and current portfolio positioning from the manager of the SilverPepper Commodity Strategies Global Macro Fund.

Manager Commentary: 4Q 2022

1Q 2018 Commodity

Manager Commentary: 2Q 2023

2Q 2017 Commodity

Data for your brain.

Interactive fact sheet and performance

Returns as of 06.30.2023
YTD1-Yr3-Yr5-YrSince Inception
Institutional class - SPCIX-13.06%-16.19%6.62%2.77%-0.23%
Advisor class - SPCAX-13.30%-16.35%6.56%2.75%-0.32%
Bloomberg Commodity Index-3.44%-1.30%16.23%6.13%-0.60%
Correlation to Broad Market Indexes
Since Inception
Bloomberg U.S. Aggregate Bond Index0.08
S&P 500 Index0.43
Bloomberg Commodity Index0.83
Standard Deviation
Since Inception
SilverPepper Commodity Strategies Global Macro 10.85%
Bloomberg Commodity Index14.30%

Current Portfolio Exposures: Click Here

Monthly Returns, Institutional Class

JanFebMarAprMayJunJulAugSepOctNovDecYear
2023-1.63%-4.98%-0.63%-1.92%-5.70%2.76%2.51%-2.46%-1.51-13.06%
20228.30%3.89%8.98%2.16%0.86%-10.48%1.38%1.89%-8.44%-2.36%4.38%-5.41%3.13%
20211.07%5.52%-4.68%9.46%3.20%0.93%1.84%-0.20%4.23%2.42%-3.87%1.32%22.50%
2020-6.79%-2.91%-5.46%-0.72%2.03%0.71%6.22%6.13%-4.27%-1.18%6.76%4.60%3.95%
20195.41%0.98%-0.85%-1.59%-1.61%1.39%-0.99%-2.38%0.90%1.53%-2.13%3.27%4.34%
20182.35%-3.29%-1.13%1.72%2.25%-3.74%-1.83%-1.28%0.35%-1.65%2.03%-4.11%-8.30%
20170.33%-1.31%-1.66%-1.69%-2.06%-0.70%2.00%0.81%0.80%1.25%-0.67%0.86%-2.12%
2016-0.46%-0.23%1.51%0.69%-1.48%3.00%-0.22%-1.57%1.71%0.45%0.78%1.11%5.30%
2015-0.43%-1.72%-1.42%1.11%-0.11%0.33%-2.52%-0.67%-1.13%-0.23%-0.57%0.00%-7.17%
2014-0.30%0.00%0.50%0.00%0.10%0.70%-0.69%0.00%-1.59%-0.61%-1.43%-3.41%-6.59%
20130.10%0.00%0.10%


The returns represent past performance. Past performance does not guarantee future results. Investment returns and principal value of an investment will fluctuate so that an investor’s shares, when redeemed, may be worth more or less than their original cost. Current performance may be lower or higher than the performance data quoted. Call 855-554-5540 for current month-end performance.

Total annual fund operating expenses are 1.99% gross, 2.02% net for the Institutional class and 1.99% gross, 1.99% net for the Advisor class. The Advisor has contractually agreed to waive its fees and/or pay for expenses to ensure that total fund operating expenses (excluding, as applicable taxes, leverage interest, brokerage commissions, dividend and interest expenses on short sales, acquired fund fees and expenses (as determined in accordance with Form N-1A), incurred in connection with any merger or reorganization, or any extraordinary expenses such as litigation expenses) do not exceed 1.99% for the Institutional class and 2.24% for the Advisor class. This agreement is in effect until October 31, 2032.

Inception dates for both share classes is October 31, 2013. Performance and risk measures greater than one year are annualized. Correlation and standard deviation figures are since the Fund’s inception and are for the Institutional class shares.

Correlation is a statistical measure of how two securities move in relation to each other, ranging from -1 to +1. A correlation of 0 means the relationship between the two securities is completely random, while +1 indicates a perfect positive relationship and -1 a perfect negative relationship.

Standard Deviation is a term used to indicate and quantify risk. Specifically, standard deviation indicates the volatility of a fund’s total returns. In general, the higher the standard deviation, the greater the volatility of return. If a fund had a mean (average return) of 10%, and a standard deviation of 2%, you would expect the fund’s returns to fall within 12% and 8%, 68% of the time. And 95% of the time, you would expect its returns to fall within 6% and 14%.